ADSB.im
Simple to use ADSB Feeder Images
(not
just) for common Single Board Computers
A detailed guide to using the web interface
Introduction
In general, the basic setup should make it very quick to get you started. The bare minimum
of information is entered on the Basic Setup page, by default it assumes that you want
to track planes via ADS-B and it auto-assigns a single SDR for that purpose, and you can select
aggregators on the Data Sharing page.
But of course there is a lot more that you can do - and this page is going to walk you through
a good chunk of the options. This was written with the v3.0.0 version of the Feeder Image in mind
which has significant changes from earlier versions (and of course a newer version may once again be
different).
Feeder Homepage
On basically every page of the interface there is a link to the Feeder Homepage in the top left
corner - depending on the screen size that's either just a logo or a logo with the text ADS-B Feeder
or SDR Feeder next to it.
Menu bar
On the home page you will see one or more buttons in the top menu bar that will take you to the various
map interfaces for ADS-B, ACARS,
AIS, and Radiosonde (but only those that you have enabled will be shown).
Clicking on one of these buttons will get you to a protocol specific UI that isn't part of the
ADSB.im web interface, but instead part
of the user interface for the underlying tools that we use in order to handle data for the various protocols.
[to be completed] -- add links to walk through of tar1090, acarshub, ais-catcher, and radiosonde auto rx
On the right side of the top menu bar there are more links to UI components - either as traditional menu
bar or collapsed to a hamburger menu on small screens. The first menu item gives you access to
more Maps, again, depending on the enabled protocols. Next to that the Data Sharing links
allows you to select the aggregators that you want to send data to.
The Setup dropdown menu lets you get back to Basic Settings, setup the SDRs that are
connected to your system, or enter the secondary setup screen named Expert.
Finally, the last element is the System dropdown menu. This is where you can get to the Logs
of the various services (most users never need those, but they are critical to debug some issues users may run into),
the Support Info that you will almost certainly be asked to provide when asking for help with an issue
and a way to share very detailed diagnostics with the developers using the Share Diagnostics item.
The Management menu item opens a system management UI that will be discussed in detail below.
Backup and Restore links are also in this menu, as well as the Stats link
that opens a screen with system statistics (this isn't available at the very start of the setup, yet).
Main sections of the home page
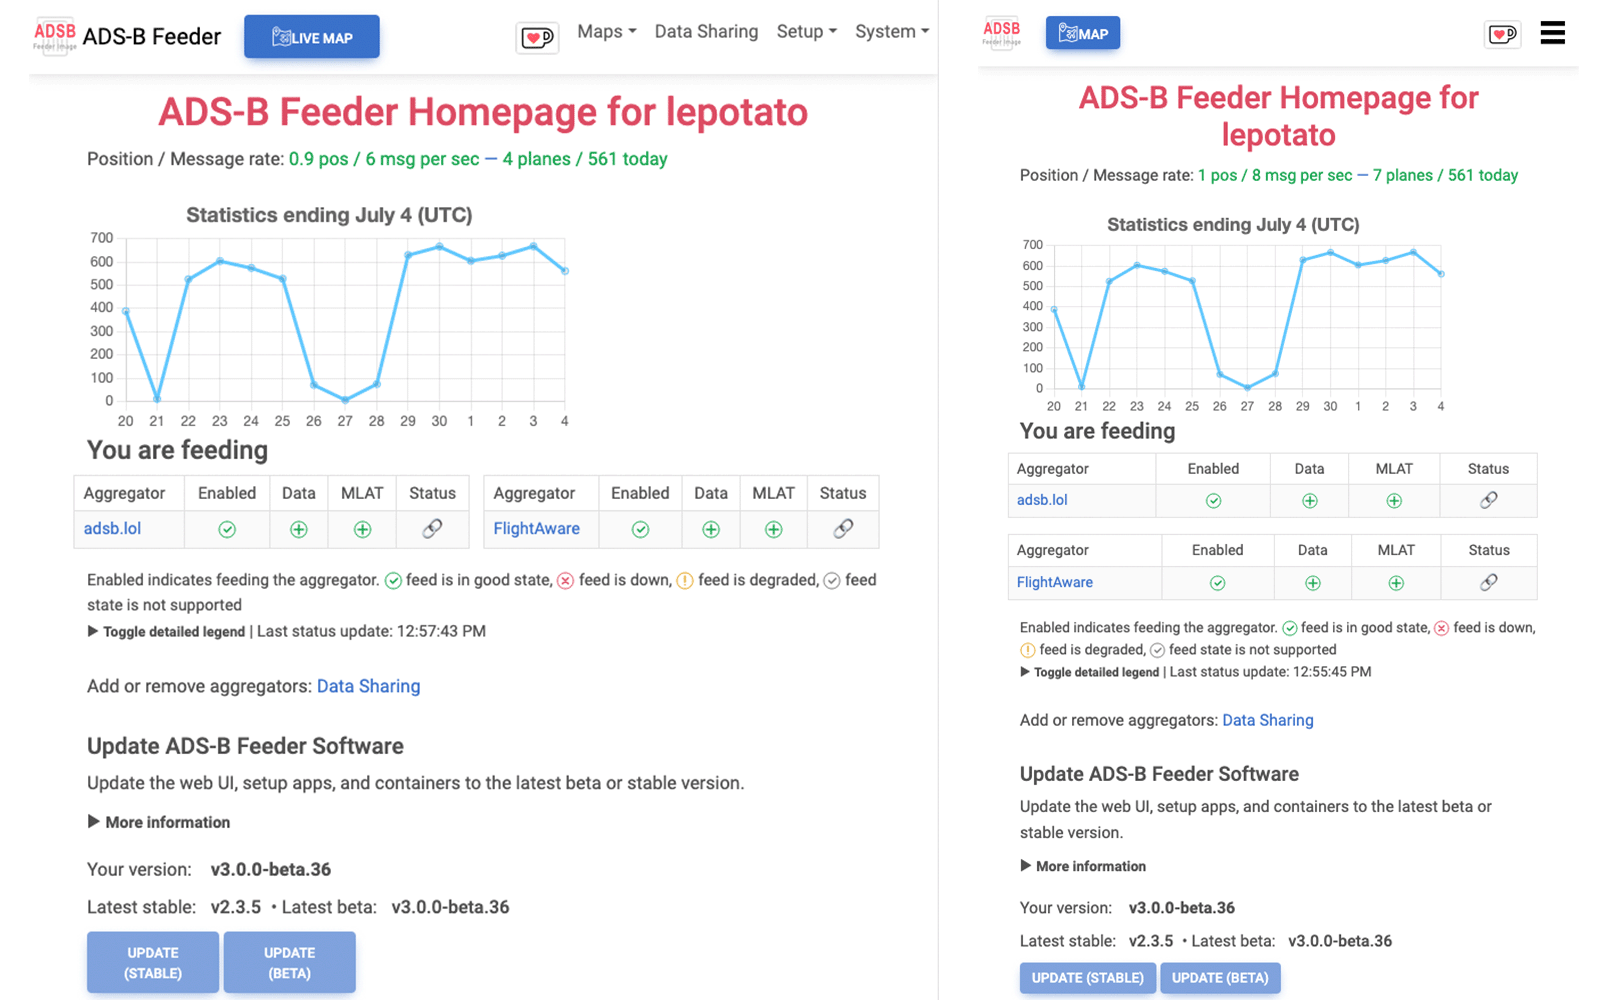
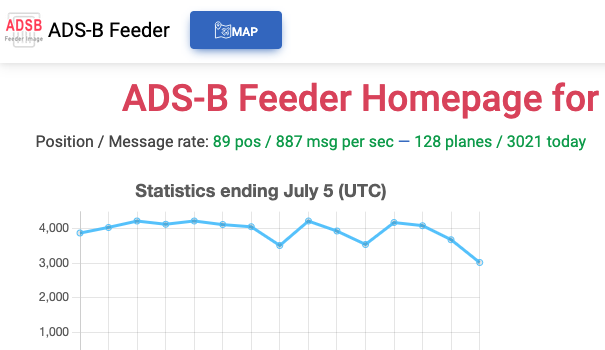 For an ADS-B feeder, the first section of the Feeder Homepage shows you information about the data you
are receiving. The current number of positions and messages per second as well as the number of planes that
you are tracking right now as well as the number of planes total since midnight UTC. The choice of resetting
the daily number based on Universal Time (UTC) and not local time is based on the common practice of most
aggregators to use this to calculate daily planes tracked.
For an ADS-B feeder, the first section of the Feeder Homepage shows you information about the data you
are receiving. The current number of positions and messages per second as well as the number of planes that
you are tracking right now as well as the number of planes total since midnight UTC. The choice of resetting
the daily number based on Universal Time (UTC) and not local time is based on the common practice of most
aggregators to use this to calculate daily planes tracked.
Below that you'll see a graph that shows the number of planes tracked per (UTC) day (extending up to two
weeks). And below that you can see the aggregators that you have enabled
either with the selection of default account-less aggregators as part of Basic Setup, or with more detailed
selections on the Data Sharing page as well as their current status as seen by the feeder. This data
can take a few minutes to update and unfortunately isn't always correct as the aggregators don't always
manage to provide accurate information from their backend systems. For those aggregators where it is
reasonably easy to do so, a link to the aggregator's status page is also shown. An explanation of the various
status icons is below that table.
The ADSB.im Feeder Software allows you
to either update to a stable or beta version with convenient buttons on the Feeder Homepage. Below those
buttons is a toggle to show the ChangeLog information for these new releases. You can also set up your
system to automatically update when new versions become available. This setting can be found under
System -> Management.
For an ADS-B feeder, below the update section are links to the various map options that are offered,
as well as links to specific personalized URLs from the various aggregatros (if any).
Finally, on the bottom of each page there is a footer that shows the current version you are running,
information about the hardware you are running it on and how you initially installed the software, plus
links to this documentation, the ADSB.im YouTube channel, as well
as the Zulip
and Discord channels where you can find people to talk to about
this software.
Maps
Maps: Options
On the Map Options page you are offered a few ways to adjust what you see when showing the
ADS-B live map.
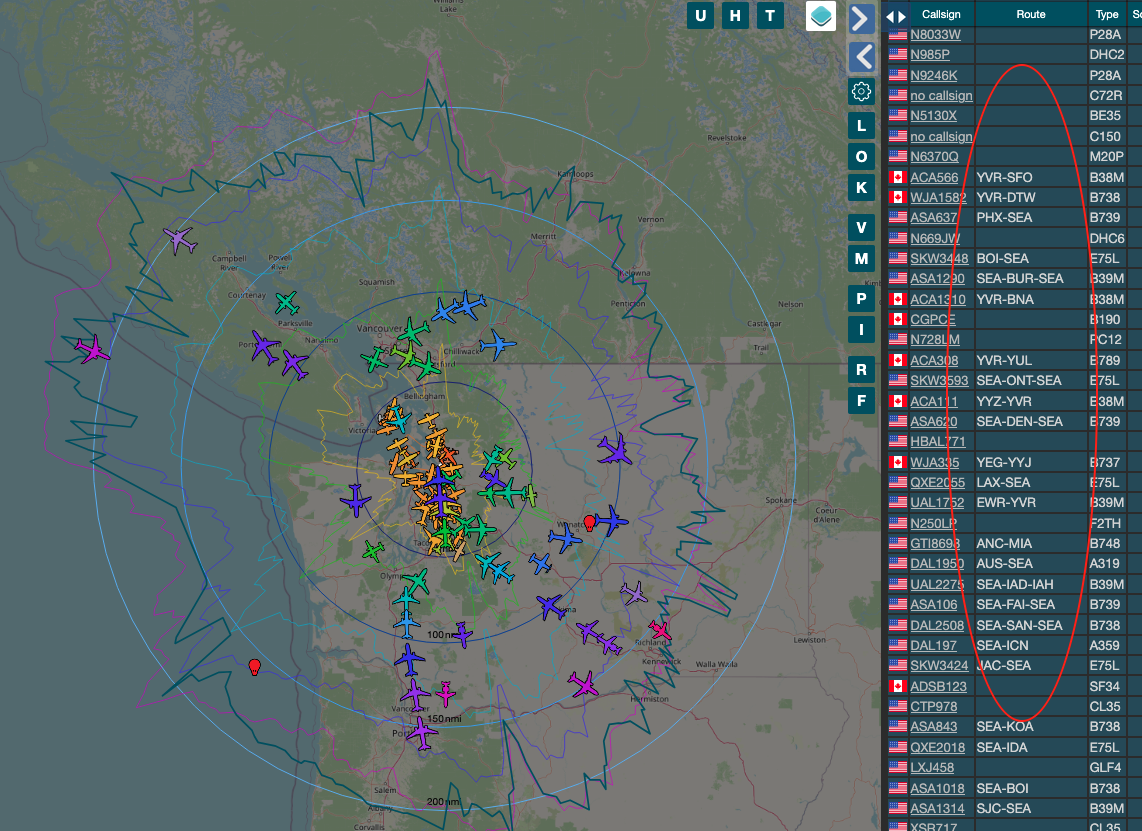 By default, the ADSB Feeder Image shows the best (open data based) guess for the route information
of the planes shown in the live map user interface as highlighted here on the right side of the
screenshot. Currently this data is created on the ADSB.im backend
server by analyzing historical data from aggregators and parsing the live ACARS and VDL2 messages collected by
airframes.io. If you don't want the route information shown on the live map, you
can turn it off here.
Based on your location and elevation of the antenna it is possible to create a fairly accurate model for how
far away a good ADS-B receiver can "see" planes, depending on their altitude.
The HeyWhatsThat website allows you to create outlines for this
theoretical range of an ideal antenna at your location. The map shows an orange outline for the range for
low flying planes and several more outlines in yellow, green, blue, purple, and pink for increasingly
higher altitudes. This outline is theoretical as it doesn't include
real world obstructions like buildings or large trees in its calculations, but it's usually a good
enough approximation. If you want to create such a range outline and have it displayed on the live map,
go to HeyWhatsThat, enter your location and create an ID which
you can then enter here.
The live map will also show a (darker green, slightly thicker) range outline that shows you the area around your location where you have received
plane data from. If you want to reset that "actual range" outline, there's an option to do that here.
Note that the range outline by default always tracks the last 24 hours of data, so things will reset on their own after a day.
By default, the ADSB Feeder Image shows the best (open data based) guess for the route information
of the planes shown in the live map user interface as highlighted here on the right side of the
screenshot. Currently this data is created on the ADSB.im backend
server by analyzing historical data from aggregators and parsing the live ACARS and VDL2 messages collected by
airframes.io. If you don't want the route information shown on the live map, you
can turn it off here.
Based on your location and elevation of the antenna it is possible to create a fairly accurate model for how
far away a good ADS-B receiver can "see" planes, depending on their altitude.
The HeyWhatsThat website allows you to create outlines for this
theoretical range of an ideal antenna at your location. The map shows an orange outline for the range for
low flying planes and several more outlines in yellow, green, blue, purple, and pink for increasingly
higher altitudes. This outline is theoretical as it doesn't include
real world obstructions like buildings or large trees in its calculations, but it's usually a good
enough approximation. If you want to create such a range outline and have it displayed on the live map,
go to HeyWhatsThat, enter your location and create an ID which
you can then enter here.
The live map will also show a (darker green, slightly thicker) range outline that shows you the area around your location where you have received
plane data from. If you want to reset that "actual range" outline, there's an option to do that here.
Note that the range outline by default always tracks the last 24 hours of data, so things will reset on their own after a day.
Data Sharing
On the Data Sharing page you are adjusting how your data is shared with aggregators. The options available
here depend on which protocols you have enabled.
For ADS-B, by default, MLAT privacy is not enabled, which allows (a rough estimate of the location of) your site to
be shown on typical MLAT coverage maps. Turning this on
informs the aggregators that you would like to opt out of having your data shown on such maps.
The rest of this page is used to select the aggregators you want to feed. The first group are the account-less
aggregators that don't require any authentication. Below them are the various commercial and non-commercial
aggregators for which you need some kind of sharing key or similar. For many of them, getting those key is
automated, others require some extra steps -- see the help texts in the UI.
For ACARS, VDL2, and HFDL, there are only a few choices available.
For AIS there are a larger number of both community based and commercial options available.
For RadioSonde at this point there appears to be only one interesting aggregator
SondeHub which is enabled by default and not shown on this page.
[to be completed]
Setup
The Basic Setup item brings you back to the initial setup - useful if you want to change the name of
your site or if you move the antenna and need to adjust the location.
SDR
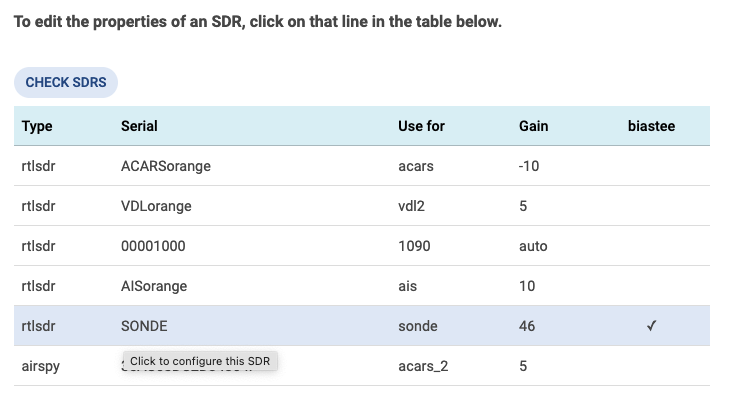 On the SDR setup page you can assign the SDRs found in your system to the enabled protocols.
By default only ADS-B is assumed as enabled, you can add support for additional protocols in the
Expert settings below.
For each of the SDRs, you can click on its entry in the table and then select which protocol it is
used for and (depending on the type of SDR and the sepecific usage) select values for gain and
potentially enable biastee support. Note that generally only one SDR can be used for each protocol,
so assigning an SDR to a protocol that was already assigned to a different SDR will change the assignment
of that previous SDR to "other".
Once all SDRs have been assigned, you must click on the "Apply Settings" button to actually
apply the changes.
On the SDR setup page you can assign the SDRs found in your system to the enabled protocols.
By default only ADS-B is assumed as enabled, you can add support for additional protocols in the
Expert settings below.
For each of the SDRs, you can click on its entry in the table and then select which protocol it is
used for and (depending on the type of SDR and the sepecific usage) select values for gain and
potentially enable biastee support. Note that generally only one SDR can be used for each protocol,
so assigning an SDR to a protocol that was already assigned to a different SDR will change the assignment
of that previous SDR to "other".
Once all SDRs have been assigned, you must click on the "Apply Settings" button to actually
apply the changes.
Setup: Expert
On the Expert page you will find some more advanced settings. There are two main sections: first
the odd settings that will be fairly specific to certain users, and then the section that allows you to
enable non-ADS-B protocols. Arguably the "Expert" page is maybe not the most logical place to enable
these features, but for now that's where they are.
In some very unusual circumstances you may want to be able to add
additional arguments for the
Ultrafeeder, e.g., if you are feeding a "standard aggregator" that accelpts beast input but
for whatever reason isn't supported by the web UI.
Similarly, if you want to access some features that don't have UI elements to support them,
sometimes you can enable them using specific
environment variables -- definitely an expert
use case. Along the same lines you can add default arguments for the ADS-B live map.
To learn more about the environment variables and arguments that are available, see the
Ultrafeeder documentation. Please note that
it become significantly harder for the team behind the feeder image to help you if you use either of these options,
so by going down that path you are decidedly in expert territory and may be on your own.
Speaking of truly advanced use cases, if you use a Raspberry Pi SBC and have connected a DHT22 temperature sensor to its GPIO pins,
you can enable ambient temperature reporting.
By default the software assumes that the DATA pin of the DHT22 is connected to GPIO 4. If you cannot use
that GPIO pin, you can change the PIN used by creating a file /opt/adsb/extras/adsb-temperature.default
with the content GPIO_PIN=22 (or whatever GPIO pin you are using).
If you want to share your ADS-B live map with others (generally only recommended if you
really understand the potentially unintended consequences - hence, again, an expert use
case), you can disable the config link on the ADS-B live map.
You can switch the CSS Theme from the default that tries to match your current browse theme
to light or dark.
For very specific situations with limited bandwidth networks, you can disable parallel
downloads of Docker containers.
Finally, as mentioned above, you can enable the various non-ADS-B protocols. Each of these
need to first be enabled clicking the corresponding "Enable" button, and then you can set the corresponding
feed IDs for each protocol -- these IDs are required as they are used to identify the
feed for the respective aggregators. The most common convention for these feed IDs is to use your initials (two or three
letters) followed by the ICAO code of the closest airport followed by the protocol you are sending (and a number to distinguish
multiple instances if necessary). For example AM-EDDF-VDL2 for a hypothetical Andreas Müller sending VDL2 messages
near Frankfurt International Airport.
ACARS supports two different instances (with separate feed IDs) as in some geographies
(mostly the US) there are more ACARS frequencies in use than a single SDR can cover. The default frequencies for the
two ACARS instances are designed that the first one by default covers all the common frequencies around the world, and
the second one covers the frequencies below 130MHz that are mainly seen in the US (and even there they are not very
common). So for most people having just one ACARS decoder is likely sufficient.
VDL Mode 2 (or VDL2) is the more modern, digital protocol for airplane messaging.
In many areas (especially in Europe) VDL2 has surpassed analog ACARS messages in terms of message volume, but in
other areas ACARS may still get you more messages. A single antenna with two SDRs can cover both VDL2 and ACARS.
Once again, the default frequencies are most likely sufficient for most people.
HFDL is operating at much lower frequencies than ACARS and VDL2 and therefore
definitely requires its own antenna - but on the flip side you typically can receive messages from significantly
further away as HF radio signals tend to get reflected and follow the curvature of earth to some degree.
The Feeder Image supports two primary ways to receive HFDL messages: first with a standard SDR
and a frequency scanning script that is integrated and usually does a fairly good job identifying the right frequencies to
listen on. So again, leaving frequencies unset is likely the best starting point. You do need to set a different sample
rate depending on your SDR. Typical RTLSDRs are handled automatically, for an Airspy you need to enter
3000000.
The other option for receiving HFDL messages is to use hfdlobvserver, which requires
access to a web-888 SDR on your local network. This is definitely a bit of a
corner case, but integrating this into the image wasn't too hard and one of the maintainers of this software happens
to own a couple of web-888s.
If any of the preceding ACARS / VDL2 / HFDL protocols are enabled, you can also enable acars2pos
which will show the position of some of the airplanes from which data was received on the ADS-B live map of your system. The
planes will not have altitude information, they will show up as white outlines, and they will remain in the last position received
for more than half an hour.
Next, you can enable AIS / Shipfeeder to track ships and their positions. Shipfeeder comes with
its own map, but once you have it enabled there's also an option to show the ships on the ADS-B live map.
Finally, you can enable Radio Sonde. For this protocol it is more typical to not use the
nearest airport and your initials but instead your ham radio callsign as identifier (but since no ham radio certification is
required to run this service, you can always go back to initials-airport as identifier). Enter the frequency range
on which weather balloons broadcast their data in your local area and decide whether you want to have your data shown on
the sondehub website.
System
Management
While in most circumstances you shouldn't need to to access the adsb feeder system
directly, if this is something you want to be able to do, here is where you enter the public
key of an ssh key-pair which will allow you to log in as root or where you can set the
root password of the feeder system to a random value that is displayed in the web interface.
Conversly, if you want to slightly reduce the attack surface of your system (for example if it is
installed on someone else's premises), you can remove some obvious attack vectors that would
allow someone else to take over your feeder by selecting Secure Feeder System.
This is not the same as truly hardening the image;
you should assume that someone with access to the hardware will be able to remove the µSD
card which will allow them to get access to the system.
There are also options that allow you to shutdown or
reboot your system. Please note that there are several
scenarios where an SBC will not successfully reboot (or not turn of power on shutdown). Please
test this capability before relying on it.
The feeder can be set up to update its base OS and / or the feeder software (i.e. the web UI that controls
the system) automatically. You can also trigger the OS or feeder software updates
manually from this page.
In situations where one of the underlying containers isn't restarted when needed, you can manually
restart or recreate either all or a subset of the running containers.
You can add your feeder system to a ZeroTier or Tailscale
global area network in order to be
able to access it remotely. Enter the network ID here (you have to set this up at the
ZeroTier website, first), or connect to your pre-existing Tailscale network.
You can reconfigure the system's WiFi network if it will be moved to a new location with a different
SSID and password.
While some of these options will be useful to most users, some of them are targeting users who are
somewhat more familiar with the setup of a Linux system. When in doubt, please ask on one of the
forums for guidance and help.
Backup / Restore
You can backup the settings as well as the history of statistics on the Backup page.
Click one of the three Backup buttons and store the zip file on your computer. You can backup just the
configuration, include the graphs, or include the full history of data.
If needed, you can later go to the Restore page (for example after installing a newer Feeder Image on
your system) and restore the data. Once you upload the zip file you will be shown all files and folders that
differ from the running system and can choose which ones to restore.
By default, the ADSB Feeder Image shows the best (open data based) guess for the route information
of the planes shown in the live map user interface as highlighted here on the right side of the
screenshot. Currently this data is created on the ADSB.im backend
server by analyzing historical data from aggregators and parsing the live ACARS and VDL2 messages collected by
airframes.io. If you don't want the route information shown on the live map, you
can turn it off here.
The rest of this page is used to select the aggregators you want to feed. The first group are the account-less aggregators that don't require any authentication. Below them are the various commercial and non-commercial aggregators for which you need some kind of sharing key or similar. For many of them, getting those key is automated, others require some extra steps -- see the help texts in the UI.
On the SDR setup page you can assign the SDRs found in your system to the enabled protocols.
By default only ADS-B is assumed as enabled, you can add support for additional protocols in the
Expert settings below.
You can backup the settings as well as the history of statistics on the Backup page.
Click one of the three Backup buttons and store the zip file on your computer. You can backup just the
configuration, include the graphs, or include the full history of data.
If needed, you can later go to the Restore page (for example after installing a newer Feeder Image on
your system) and restore the data. Once you upload the zip file you will be shown all files and folders that
differ from the running system and can choose which ones to restore.